


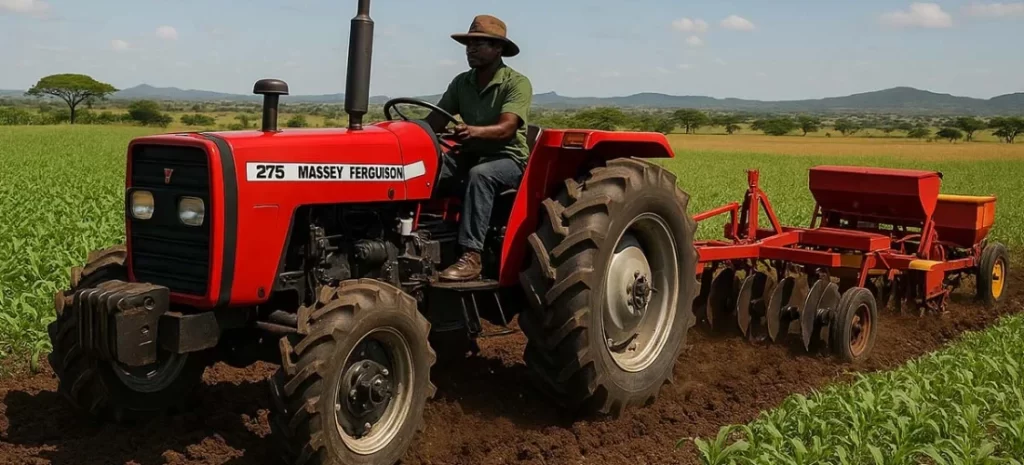
Cash Crop ROI Comparative Analysis: Short-Term vs. Long-Term Agribusiness Ventures in Nigeria
A quantitative financial assessment comparing capital intensity, IRR, payback horizons, and inflation-hedging capacity across short-term annual crops and long-term tree plantations.
Executive Summary
Agribusiness in Nigeria presents starkly different financial risk-return profiles depending on the crop gestation period. Capital allocation decisions often falter due to a misunderstanding of cash liquidity, delayed payback cycles, and macroeconomic volatility including currency devaluation and inflation.
This study synthesizes primary field data, financial modeling per hectare, and historical market prices to provide a comparative ROI evaluation between short-term annual ventures (Cassava, Maize) and long-term perennial plantations (Oil Palm, Cashew, Cocoa).
- 1. Liquidity vs. Equity Wealth: Short-term crops yield rapid capital velocity within 4–12 months with high internal rates of return (IRR), but expose operators to annual land preparation, input price shocks, and weather volatility.
- 2. Long-Term Compound Returns: Tree plantations require substantial upfront CapEx and a 3-to-5-year gestation window, but generate predictable, annuity-like cash flows for 30–50 years with lower operational costs once established.
- 3. Macroeconomic Resilience: Long-term export-driven crops (Cashew, Cocoa) provide a natural hedge against Naira devaluation, whereas short-term domestic crops maintain immediate local liquidity.
The Agribusiness Venture Dichotomy
Commercial agriculture in Nigeria is broadly segmented into short-term annual cropping systems and multi-decade tree plantations. Capital strategy depends directly on an investor’s time horizon, risk tolerance, and cash reserve liquidity.

Short-term ventures offer rapid liquidity cycles, making them ideal for small-to-medium operators seeking reinvestment power. Conversely, long-term plantations function like infrastructure investments, securing land equity and generating long-horizon yield.
Hectare-Level Cost & Yield Benchmarks
All financial models are benchmarked on a per-hectare basis, incorporating land clearing, soil preparation, improved seed/seedling inputs, fertilizer regimes, labor, and harvesting costs in the Nigerian context.
| Crop Type | Gestation / Cycle | Est. Initial CapEx (₦/Ha) | Avg. Yield / Ha | Gross Margin (%) |
|---|---|---|---|---|
| Maize (Short-Term) | 3.5 – 4 Months | ₦520,000 | 3.5 – 5.0 Tons | 32.5% |
| Cassava (Short-Term) | 10 – 12 Months | ₦680,000 | 20 – 28 Tons | 38.4% |
| Oil Palm (Long-Term) | 3 – 4 Years (35+ Yr Life) | ₦1,250,000 | 12 – 18 Tons FFB | 58.0% |
| Cashew (Long-Term) | 3 Years (40+ Yr Life) | ₦950,000 | 1.2 – 2.0 Tons RCN | 62.5% |
| Cocoa (Long-Term) | 3 – 4 Years (30+ Yr Life) | ₦1,100,000 | 1.0 – 1.5 Tons Beans | 64.0% |


Cash Flow & Payback Horizon Dynamics
While short-term crops achieve payback within the first 12 months, long-term crops experience negative cash flow during years 1–3 before entering an accelerated profit phase that far surpasses annual crops over a 10-year period.
Short-term crops return capital rapidly, providing cash flow to cover immediate operational overhead and debt servicing.
Long-term crops reach initial bearing stage. Cumulative cash flow crosses break-even point around Year 4–5.
Tree crops hit peak yield. Maintenance costs plateau while yields and revenues compound over decades.
Inflation & FX Risk Resilience
Nigeria’s economic conditions require agribusinesses to insulate themselves against inflation and currency fluctuations. Short-term and long-term crops respond differently to macroeconomic shifts.
Long-term crops like Cocoa and Cashew priced in USD on global markets provide a strong natural hedge against Naira devaluation.
Short-term crops require annual purchases of fertilizer and seeds, making them vulnerable to rising input costs year-over-year.
Cassava and Maize allow producers to adjust prices directly with local inflation, maintaining short-term operating margins.
Permanent tree crops increase land value over time, turning real estate into a high-value productive asset.
Hybrid Intercropping Portfolio Model
To optimize financial performance, leading commercial farms utilize a hybrid portfolio strategy. By intercropping short-term annuals within non-bearing long-term plantations during Years 1–3, operators generate liquidity to offset early CapEx.
| Development Year | Primary Crop (Long-Term) | Intercrop (Short-Term) | Primary Cash Flow Source | Net Liquidity Status |
|---|---|---|---|---|
| Year 1 | Oil Palm / Cashew (Immature) | Cassava / Maize / Cowpea | Intercrop Harvest Proceeds | CapEx Recovery |
| Year 2 | Oil Palm / Cashew (Immature) | Cassava / Groundnut | Intercrop Harvest Proceeds | Operational Break-Even |
| Year 3 | Initial Canopy Closure | Short-Cycle Pulses | Transition Phase Yields | Positive Cash Flow |
| Year 4+ | Mature Tree Plantation | None (Full Canopy) | Commercial Tree Crop Sales | High Annuity ROI |
Venture ROI & Payback Estimator
Estimate financial returns and payback timelines by selecting crop venture parameters and land area below.
Agribusiness Yield & Revenue Projection Model
References & Data Sources
- Federal Ministry of Agriculture and Food Security (FMAFS) – Annual Crop Production Statistics.
- Central Bank of Nigeria (CBN) Anchor Borrowers’ Program Agribusiness Benchmark Reports.
- International Institute of Tropical Agriculture (IITA) Agribusiness ROI & Yield Datasets.
- Nigerian Export Promotion Council (NEPC) Non-Oil Cash Crop Market Benchmark Studies.
- National Agricultural Extension and Research Liaison Services (NAERLS) Cost-of-Production Audits.
